Borg Charting a Cheater

In the wake of my previous studies, proving that winners in cat B-D make a lesser effort than the rest of the podium, as opposed to cat A where winners make a harder effort, a question kept resurfacing in the discussions on the Zwift forum: Is it really reasonable to assume that you can detect cheating (cruising) from just looking at a HR distribution chart?

Coming from the outside it may indeed seem like a fair question. I would, however, like to argue that it is not, that you are missing the point. The point is that cruising is the HR distribution graph. You can’t really detect it any other way, not even in theory. In fact, you can’t really define it any other way. I will try to explain. But first one of those mandatory detours that come with this blog.

I thought we would start off with discussing dead celebrities. Let’s leave the boring Club 27 out of the picture for a change. But do you know who Borg was?

No no, not that Borg. I am referring to Gunnar Borg, PhD MD and former Swedish professor in psychology. 

I saw him in person a few times while he was still active since he was working at the same campus I was studying at for some years. He and his colleagues used to hang by themselves in this creepy brick building that looked more like a crematory than an academic faculty. Psychophysics. Supposedly, the house made for a good lab environment, whether they actually incinerated failed students in there or not. We weren’t sure.

Anyway, Borg, who died early this year (from old age, I would presume, after a long and productive life) is a world celebrity in our game. No, he was not a cyclist, but he was and remains the go-to guy when you need to put a measure on your physical efforts but lack data on Watt, heart rate, max heart rate, lactate levels, etc. Or when you want to match physiological measures to a person’s perceptions of what is going on in his body, regardless of whether this person is an elite athlete or someone with a possible heart condition visiting a hospital lab. 

Borg is famous for the so-called Borg Chart, widely spread in both sports physiology and medicine. You have surely seen it before. If not in this exact form then at least its elements will be familiar to you.

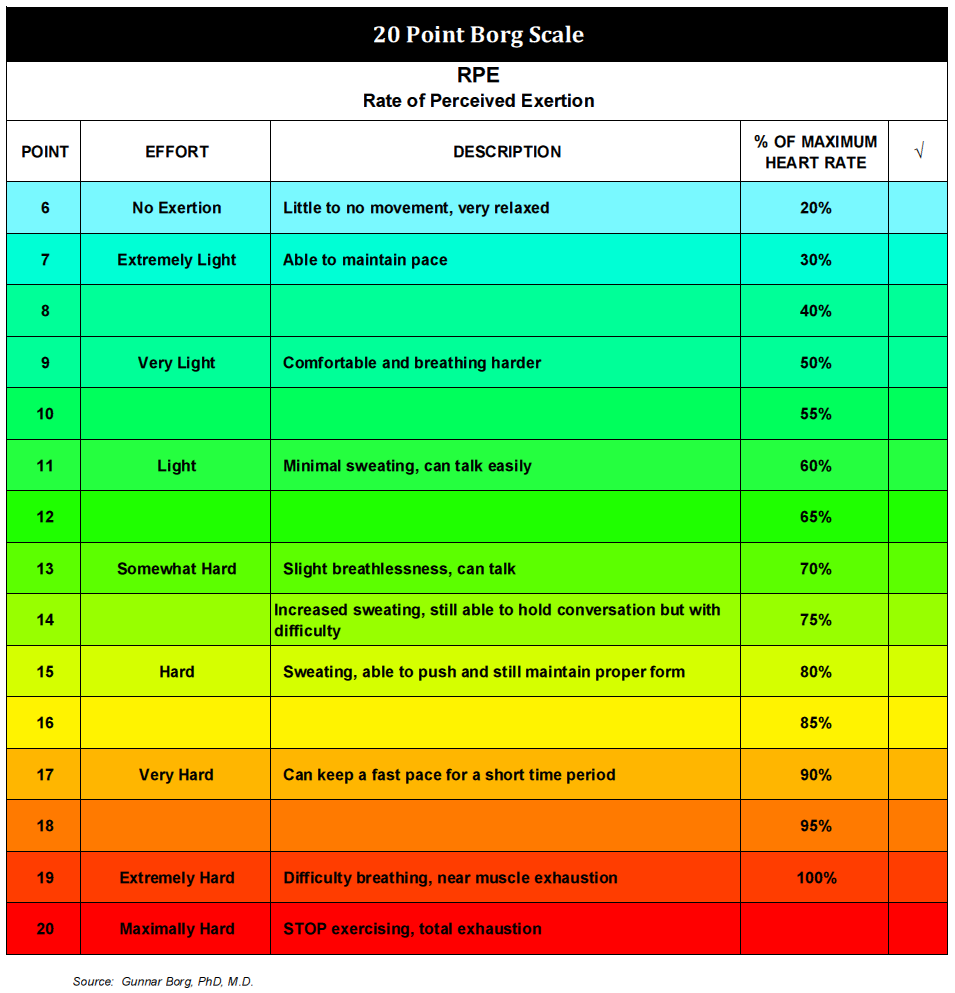
Along with the Borg Chart there is the Borg Scale in which you estimate your physical exertion from 0 to 20, where 20 would be the point of failure e.g. at the end of a ramp test, one where you don’t hold back. The rest should be familiar too. If you look higher up in the chart above you can find the “can talk“, a familiar cue from your recovery or fat burning rides, and so on. Yes, there is a corresponding scale in Strava that you can use when you don’t have a power meter or a heart rate monitor. And it all started with Borg.

On the right you can see the rough percentage of your maximum heart rate that each level of exertion corresponds to. Even though how your working heart maps to your perceived effort can vary a little from individual to individual, there is still a pretty hard correlation between the two. For example, it is very hard to talk at VO2Max (above 90% max HR) for anyone, and it is not something you can get used to or learn. It is just the way our bodies work. Nor can you go beyond 20. There is no “you can always dig deeper, what doesn’t kill you…” when you are at a perceived 20. Max is max, and your legs just stop working.

Obviously, the Borg Chart is relevant when we once more turn to cruising.

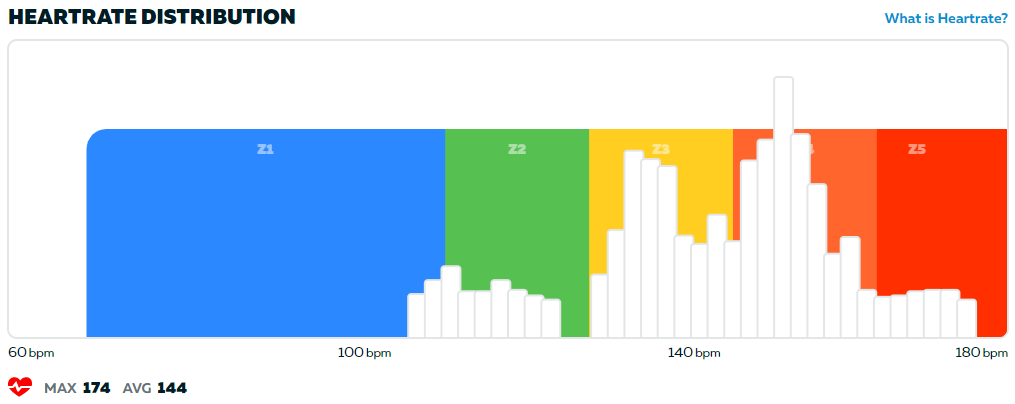
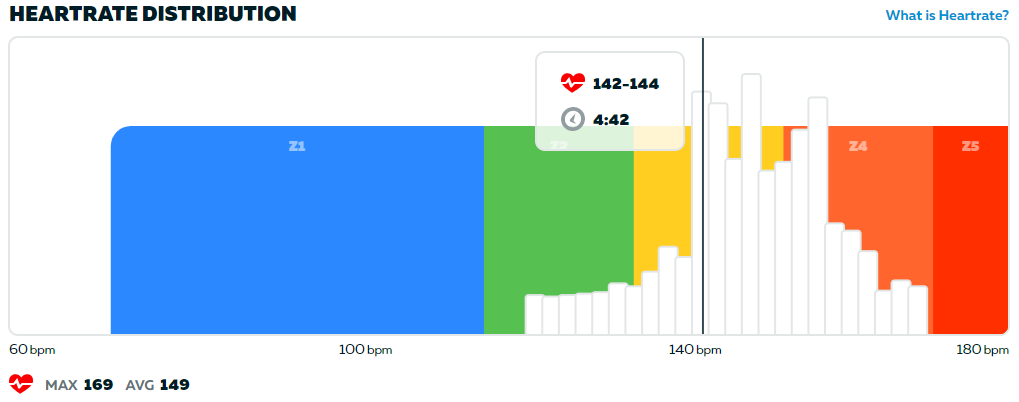
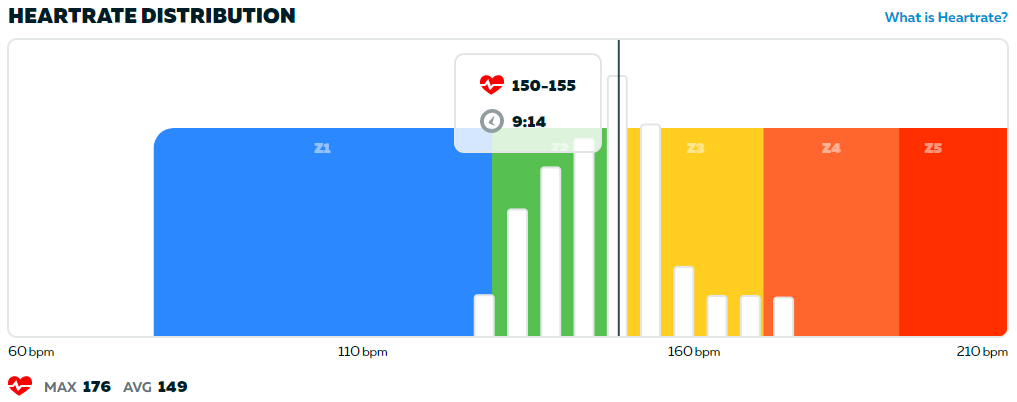
I thought I would show you some examples of HR distribution graphs from Zwift again. The other day I posted a race report. The effort in this race can be summed up as follows:

The green part is the spindown and can be ignored. But look at the rest. Was I cruising this time or not? Couldn’t this be a fairly normal, legit race?

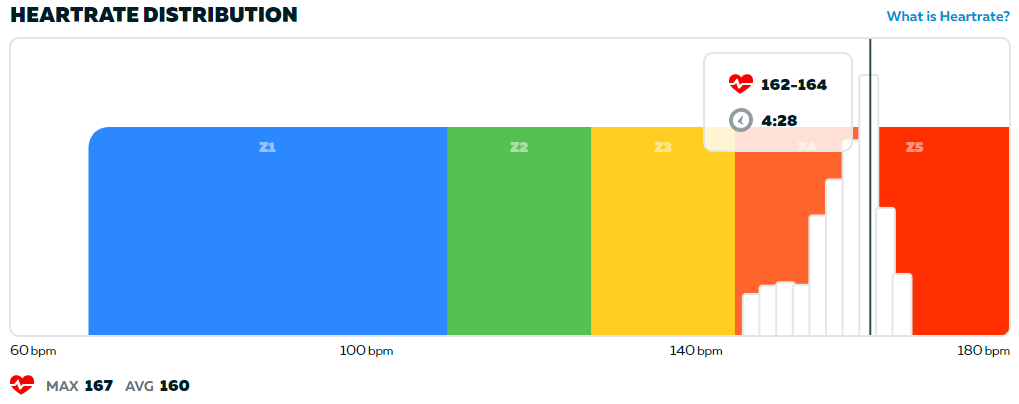
We need a point of reference, something to compare with. Here is another race from last year when I was more fit but also had a max HR that seemed to be a couple of beats lower than today. It’s a 3.2 W/kg effort that still left me well outside the podium in cat C on ZP:

Do you notice any difference between the two graphs? 

Returning to Borg, what was the perceived effort in those two races? Let’s start with the second graph. A large part of it was spent above 160 BPM, as you can see. In my case, with a max HR of 173 at the time, this meant 92% of max HR. If you refer to the Borg Chart above this should mean that I perceived a large part of the race as “Very Hard” or worse.

Did I? It checks out. I can attest to that. Or to put the perceived effort in my own words: It was something of a OH-GOD-PLEASE-MAKE-IT-STOP-I-CAN’T-TAKE-IT-ANYMORE-I-WILL-SELL-MY-BIKE-TOMORROW kind of effort (and the day after you are none the wiser).

So what about the first graph? First, I was actively cruising. I had signed up for a D race. I am not as fit today as in the other race, which should have pushed my bars in the graph to the right compared to if I had cruised this race a few days after the first one last year. And this push to the right would also translate into a somewhat higher perceived effort. Even so my perceived effort of the cruiser race was that it was quite easy.

Let’s repeat this AND look closely at the first graph again:

  1. I signed up to a lower category 
  2. I consciously cruised 
  3. It felt easy

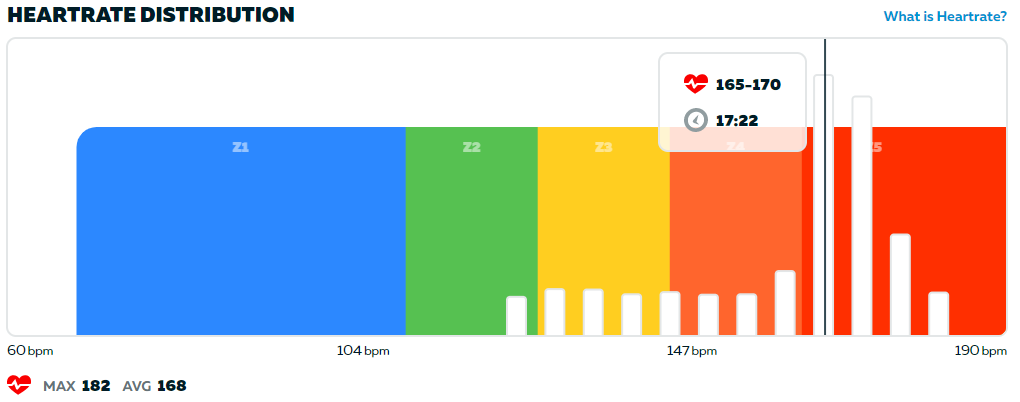
Now let’s look at another rider in a race that I participated in a few days ago. The winner in cat C, according to ZP, looked like this:

It should be noted that this rider is very young, a teenager, so he should normally have a max HR in the 200’s. He has won about half his 30-some races on ZP [sic!]. In this particular race he was followed by a podium that looked like the second of my graphs, the “Very Hard” effort according to the Borg Chart.

You are the jury here. What is the verdict? Make ample use of the Borg Chart if in doubt. Did he cruise? Or does he just have a serious heart condition capping his HR, a condition that somehow still lets him win half his races? (I bet you can beat his win-% easily.) Or was there perhaps just a glitch? Maybe Martians sent some rays that affected the graph? Or maybe he has Martian DNA himself and that this is what a typical low cat winner’s HR graph looks like on Mars?

You are the jury here. What is the verdict? Is it at all possible to separate at least some cruisers from legit racers by merely looking at HR distribution graphs?

You are the jury here. What is the verdict? Refer to the Borg Chart again. Is it reasonable that someone can win half his races while talking to a friend without too much difficulty (70% HR), while other contenders can hardly breathe (90% HR) and all of them, winner included, are at or close to the performance ceiling in the category and would get a DQ if they went any harder? Are the W/kg categories appropriate for a sport?

Tagged :

Race Report: 29 Aug 2020, 3R Volcano Climb Race

I should lay low, waiting for the cat downgrade by next month’s end, now that I already have a nice triplet of sub-2.5 races in the ZP race records. But I just couldn’t help myself. I had to cheat a little more today and picked this shortish race. It seemed ideal. I chalked it up as honing my cheating skills.

The start was hard. A few D’s joined up with some C’s in a D front group that I decided quickly not to try to go with. I went with the second group instead the initial km’s, but we actually caught up with the front group in the underwater tunnel and stuck with them. 

I was monitoring my Watts in the Wahoo Fitness app closely of course, and some 12 min into the race the group was still pushing 3.0-3.2 and my average W was by then dangerously high, well above 200W. At 68 kg plus another 7 kg of unflattering belly fat, I had only 8 min to get the average down to 185W, my mark to be on the safe side.

I dropped and just spun the legs for a few minutes. Some C’s went past. Approaching the foot of the volcano a mixed C/D group caught up with me. I had monitored them for a while and they weren’t going much slower than the group I had dropped from, so I quickly decided to let them just pass. 

It actually seemed to take a while for the possibly legit D’s to reach me, so I then opted for a semi-slow pace of 2.0-2.2 to postpone getting caught as much as possible. I wanted to give them reason to work hard to wear them down. It turned out I timed it well. By the time the first seemingly legit D rider caught up with me, I was barely below the 185W mark. 

I stopped the Wahoo clock and restarted it after around 24 min and by then the average was still dropping. The first 20 min are always the most dangerous, the time frame where you are most likely to go over limits as a cruiser. Since I can’t actually measure a rolling 20 min window in the Wahoo app, and since the race would last around two flips of a 20 min hourglass, it made sense to restart the measuring just to be sure I wouldn’t go over limits on the second half. It seemed unlikely but you never know what comes from behind.

The D rider that eventually caught up with me, an Englishman, came together with a C rider that we both let go once the climb started. The Englishman, who later got the silver on ZP, seemed well aware of the situation in the race and quite possibly what I was up to as well. I let him do all the work of course. Not that we were going over limits, but I wanted generous wiggle room in my average for the final stretch and it seemed like I would be getting plenty of wiggle.

Towards the latter part of the climb a Norwegian D caught up with us. I had decided to let it happen. After some struggle around who would pull or set pace, the Norwegian decided to up the pace. The Englishman seemed to make a quick decision to let him go. To me, though, it was a tough choice. On the one hand the Norwegian was pushing 2.7 and it was still a little early to let my average rise again. (Also, he could have been going quite hard solo to get to us, meaning he might even already be DQ’d.) On the other hand, this was a climb, which could motivate a high tempo in the climb since the Norwegian would most likely slack off a bit on the descent. 

I reluctantly let the Norwegian go. Then I changed my mind and dropped the Englishman to bridge to my neighbor (I’m Swedish as you know) by the arch. As I suspected the pace dropped significantly on the descent and I think I hit a low of 169W on my second cumulative average. That meant I would be able to go flat out for quite some time toward the finish. The question was only when to drop the hammer.

During the final part of the climb I noticed that guys from the front D group were once again visible in the list on the right. They had slowed down considerably. In fact, they were only some 17 sec away. Potentially, they could pose a threat. And potentially, I could bridge to them if they kept the pace for yet some time. But they went so hard the first 20 min… I decided against trying to catch up with them, which would have meant an early hammer, a real effort in fact.

Remembering my last cruise on Champs Elysées, where I had brought out the hammer from the back pocket at the overpass, some 1.5 km away from the finish, I decided to go a little later this time. The Norwegian was most likely heavier than me and with more muscle mass (the average rider always is), so I couldn’t risk a sprint against him. I would have to drop him well outside sprint range. 

By the 900m mark I decided it was hammer time. The Norwegian didn’t fight back. With a safe time gap I coasted the last meters to the finish.

Obviously, I got a UPG on ZP for this but stayed safely within limits for an average of 2.4 W/kg. The Norwegian got a DQ too or wasn’t registered. And, as mentioned above, the Englishman took the silver 40 sec behind me. Come October and I will steal that silver.

So who won then? According to ZP a kid took it down. Exploiting the sub-200W limit of cat D at 38 kg and 149 cm, he pushed a legitimate average of 3.8 W/kg. And won of course. 

I wouldn’t want to the deny a young boy the pleasure of winning a race or two in Zwift. Really. Because it will do him far more good than for us grumpy old men. But still… what can you say? Well played, ZP! Hope you’re doing alright so far down in the bunker.

My effort for the race was as follows:

Ignore the green blob. That’s the spindown. Consider the rest. Don’t think for one second that this is what a reasonable race effort over 42 min may look like, that it is somehow within the acceptable range. The racing was a complete joke. That’s what cruising is about after all, a slice of roflcopter with some WTFPWN! sprinkled on top. I could have gone MUCH harder. I should be going MUCH harder. I would have gone MUCH harder in my true category. And any race participant in Zwift with their FTP set correctly would have to work MUCH harder doing e.g. the McCarthy WO or Zwift’s 30/15’s GWO.

Think about that the next time you see a HR graph like this from a race podium.

Tagged :

Der Untergang

Can you hear the rumbling, people? It may have seemed distant before, but it is creeping closer and closer for every day. Bad omens in the sky. Seals being broken one by one.

And on the crumbling tarmac on top of the ZwiftPower bunker an armada of belligerent racers roll in, complaining over massive cheating in Off the MAAP Tour and elsewhere, riders racing fair attacking cheaters in the race chat.

Let’s face it, the W/kg categories are falling apart. This is not the end of the beginning. This is the beginning of the end. The End of Days, the Untergang.

And from the ashes a Phoenix will rise.

Tagged :

While the Watopia PD Looked the Other Way

Summer vacation drew to a close and now I’m in the city again with days that grow shorter and over 30 min to get to roads even remotely worth riding. And so I’m back in Zwift on weekdays. Time for some cheating!

I noticed that my last little screwup in a race was 1 Jul. Well, it wasn’t even a race but an official group ride and ZP picked it up. I got caught on the Watopia PD speed camera doing 2.8 W/kg. But I have served my sentence on 1 Oct. Or should have. We’ll see, because my current 90 day top 3 average doesn’t actually correspond to activities I have participated in. But anyway, I thought I’d prepare for an autumn of intense, relentless cheating. And for that I need a “legitimate” downgrade. Thus I needed two more races staying within cat D limits.

Filler Race No 1

First was the Namibian Race League of 23 Aug. I had just recovered from an infection with fever the day before. Not covid this time but bad enough to call in sick. Safe to say, I was in pretty bad shape right after and so the race actually turned out to be fairly tough although I did hold back somewhat. 

Since I was set on monitoring my average Watts closely, not to let it slip beyond 187W at 75 kg, I decided to go “easy” at the start (meaning hard instead of the standard insanely hard). So I let a front group or two of sandbaggers go straight away. 

There is always the risk that there is a piggy-backing legit rider on the wheels of the front group frequent flyers. Or a cruiser. If it’s a cruiser, then that’s a risky strategy. He is then banking on the group slowing down considerably mid-race, or he runs the risk getting a DQ or even screwing up your categorization. It can pay off though, and if you let a guy like that go, you won’t catch him. But a legit rider you may have to let go. The hard part is telling which is which. In this case, though, there was no doubt about it. I would let them go.

After the start I decided to drop two more times ending up in chasing groups. You start with an initially very high average Watt. It will drop over the course of the race (I have no means to measure a semi-rolling best 20 min, so I have to play it by ear partly, relying entirely on the total average). It just has to drop enough over time and it is not always easy to predict whether the drop rate will be enough.

In the final climb I decided to start sliding down immediately, although I ended up also catching up with a few riders who went too hard at the foot of the hill. I was already at the target 2.5W/kg I had set in my mind and just tried to stay there.

This so-called effort, if I had been downgraded already, would have sufficed for a bronze. It would have been hard to improve on the result further, though, at least on a day like that. The winner was a heavy-weighter with a private Zwift profile (and thus no HR data) and a 45 sec lead on the runner-up. Go figure. 

Filler Race No 2

The second race, The KISS Underdog Series of 23 Aug, 3 laps around Champs Elysées, was a bit funny in that it turned out so soft and mellow. I had opted for a 2.3 W/kg to pull the 90 day top 3 down a bit to get some leeway in October, so I was nowhere near VO2Max at start. I went really slow and just stepped on it briefly from time to time to bridge early gaps forming. I also decided to race as a C for a change, so I was only really cheating in my imagination. 

Some D riders slipped away one by one during the first third of the race, looking fairly legit. But I had an average to protect, a low one at that, and had already accepted a placing way down the imaginary D field. 

Soon enough a nice group of maybe 8 or so riders formed, mostly D but with some other C rider too taking it slow. The group was going well below cat D limits and I was sure we were quite far down the field by then.

The group kept together and I kept my Watts low and even, staying in the draft. During the first part of the third lap the group became a little antsy. No surprise there. And also no surprise than things also calmed down a few km before the finish, as the group was preparing for the final dash. 

Since my average Watts had dropped so low there was a little room to play, so I had decided well before the overpass on the final lap that I’d hammer the climb and then just keep stepping on it until the finish. This was my first time riding the course but I had noted the distance to the finish from the overpass already on the second lap.

Appearing as a blue dot in a clutter of yellow dots on the minimap, there was no incentive to chase me down of course, but I’m pretty sure I would have pulled it off even as a yellow dot. I dropped the group hard and kept at it almost all the way to the finish. Doing so I passed several D stragglers ahead of the group I broke off from. On the final stretch I took a quick breather behind one of them before beating him in a sprint that he initiated. This was, surprisingly enough, the ZP legit silver guy. So come October and this could have been a “legit” silver. All while the Watopia PD looked the other way. But the Law of W/kg is just! Right?

The winner in cat D? Well… have a look at the HR graph yourself. I won’t comment on it. But I can’t refrain from commenting on the winner of cat C in the same race. Even though I have stated before that you will find that cruising is very common once you start looking, you will nevertheless have a hard time finding a more ridiculous display of cruising than that. Absolutely priceless! And the Watopia PD just looked the other way.

The Perceived Effort of Race 2 and a Comparison

So how was the perceived effort in this second race? Well, I’d call it light excercise by my Zwift frame of reference. Remember my How to Spot a Cruiser post? Remember the example HR distribution graph, taken from a notorious cruiser? This is what my own graph looked like. A Zone 3 effort. This level of effort is piss easy. It is racing most foul.

I refuse to be beaten by a “legit” Zone 3 guy while pushing a high Zone 4 in a race in the lower categories. And so should you.

Tagged :

Cruiser Sunday Studies – Part 3

We turn again to our investigations of ZwiftPower race data. In the second of the recent Cruiser Sunday posts I discussed briefly whether the spotted difference between cat A and cat C with regards to relative effort levels among top contenders was statistically significant. Now we will try to analyze race data properly, with a third approach.

An Explanatory Sidetrack

We will start with a little loop before we get back on track. Imagine you have kids and that you recently moved to a new area. There are two nearby schools to put your kids in and you have the choice between either and want to choose the one where the students have the highest grades. Is there a difference at all, and if there is, can we somehow determine whether that difference is not just random?

Or let’s make it really simple. You and a friend throw dice. You roll a die 100 times each. The objective is to score the highest total. If the dice are fair, then there should be no difference between your results, right? Or rather, there will be a difference but only a small one. Either of you had a streak of luck resulting in a slightly higher total. Do it all again and it might be reversed. 

But if it turns out your friend’s total is 516 and yours is only 321, is that just luck? Well, in theory it could be. It’s just not very likely that you will see such a large difference. He would have to have rolled a large number of 6’s to get to that total score. It could happen once in a blue moon, sure, but at the same time it wouldn’t be unreasonable to suspect a loaded die. Or?

A better approach here would be to not begin with trying to decide whether the difference is random or not, because right now we don’t know, but rather to start with determining how likely such an extreme random difference would be. Maybe the difference isn’t that big after all when it comes to probabilities?

Fortunately, there are ways to determine this likelihood for various scenarios. In the case of the schools or the dice you can use a fairly simple statistical test called the Mann-Whitney U-test. If the test score is high enough, it indicates that the probability that the differences in dice total is just random is very low. 

You typically set a limit beforehand as a decision rule. In smaller studies where the results aren’t life critical, a 5% limit, a so-called 5% confidence interval, is standard. So if we were to do the 100 dice rolls over and over and you would see differences of the magnitude of 516 vs 321 only in less than 5% of the trials, then we have decided that it is so unlikely that we are better off looking for other explanations than just chance. I.e. we would rather suspect that your friend is cheating.

We will use this same method when looking at the race results on ZwiftPower next.

Method

We will look at HR distributions graphs on Zwift.com among the top 3 in 100 consecutive races in the recent past, in both cat A and cat C.

If a rider spends the best part of his time in the race in a higher HR zone than the other two, visibly so, then that rider has worked harder. The HR graphs aren’t a perfect description of everyone’s fitness, especially when HR zones aren’t tuned to an individual, but on average they will be and we are looking at 300 riders in each category. It will likely average out.

If the winner of a race has worked harder than the rest of the podium, then we will score that race as 0, meaning nobody worked harder than him. If either of the other guys have worked harder than the winner, then we will score the race as 1, meaning one guy worked harder than the winner. If both of the other riders worked harder than the winner, then we will score the race as 2, meaning two others worked harder than the winner.

If there is no HR data available for someone on the podium, we will skip that rider and instead look at the next guy on the results list. It is not uncommon that HR data is missing and the typical reason is that the rider’s Zwift profile is set to private. So if the winner has no HR data, then we will compare the no 2 guy to the no 3 and no 4 guy instead. And if the no 3 guy has no HR data, we will compare the winner to the no 2 and no 4 guy instead. The reason we do this is that the display of all recent races on ZwiftPower is somewhat limited and we need to make sure we get a sample size big enough, 100 races. And it should really make no difference when it comes to our assumptions, or our hypothesis in this study. More about that below.

Once we have scored 100 races in cat A and cat C, we will then compare the results using the Mann-Whitney U-test. If there is a difference big enough to be statistically significant (remember the 5% rule here), then and only then will we draw uncomfortable conclusions.

Hypothesis

Assume we are with the ZP team and we LOVE the W/kg category system. We firmly believe it is fair and reasonable. Every sport should be categorized with W/kg, we think. There is no better option. We just need to get rid of those pesky sandbaggers first somehow…

Then what do we expect in a race with regards to relative effort levels among the top contenders? Perhaps there are two possibilities here. We could for example assume that the strength and prowess among the top contenders is roughly the same. So why does someone come out on top? Because he works harder than the others. All else equal, on average, someone working harder than the others will win. So we expect the winner to have worked the hardest (score 0).

Or we could assume that winning a race isn’t just about working hard, even if you are as fit as other top contenders. It is also about random events in the race, such as splits and breakaways and powerups and whatnot. Maybe those random events, a.k.a. luck, play such a large part in a race that we can’t separate the podium places with differences in effort levels. So instead we assume that the relative effort among the top 3 will be roughly the same. Obviously, the top 3 will be more fit and potentially also work harder than the ones coming in last in a big race, but among the top 3, we assume that the effort of each respective rider will be about the same, if not in every race then at least on average in 100 races. Thus what we will not see is a tendency for score 2 in a lot of races. Rather, races will converge around score 1. 

And what do we expect when comparing cat A with cat C? We expect to see no difference in relative efforts in the two categories. Cat A riders might be used to working harder but when comparing the top 3 in a cat A race, there should be no greater differences among them than among the top 3 in a cat C race. There may or may not be a difference in overall relative effort between cat A and cat C but there will not be a difference between riders in a category that is different from the other category.

Possibly, since we make no distinction between A and A+ riders, and since it is not uncommon that a cat A race is won by an A+, followed by two A riders, we might find a slight tendency for cat A winners to work a little less hard than the rest of the podium. We do not, however, expect to see this in cat C. Because cat C is fair and the W/kg system is appropriate in Zwift, or so we claim.

The “Oh Shit!” Scenario

Now, if we were to find that there is a tendency for cat C winners to work less hard than the rest of the podium, and that there is less of that tendency in cat A, then that would scare us. Because it is unintuitive. Why should races be won by people who work less hard than others, especially when there is an upper limit to performance (W/kg) in a category? We wouldn’t like that. It goes against the nature and ethics of the sport and would distance us from outdoor cycling too.

And it may also indicate that the phenomenon of cruising is a real issue in the lower categories, i.e. that some riders exploit the W/kg system on ZwiftPower by staying behind in a category they are too strong for, making sure they don’t go over W/kg limits, and thus get an unfair advantage in races over riders who couldn’t go over limits due to fitness and who would have to (and will) work extremely hard to finish anywhere near the top.

Results

100 races were sampled starting Fri 7 Aug 2020 and forward in cat A and cat C. According to the scoring method described above, cat A got a total score of 80 whereas cat C got a total score of 106. 

In 43 races in cat A, the top 1 guy worked harder than the following two. In 34 races in cat A, one following rider worked harder than the top 1 guy. In 23 races in cat A, both following riders worked harder than the top 1 guy.

In 29 races in cat C, the top 1 guy worked harder than the following two. In 36 races in cat C, one following rider worked harder than the top 1 guy. In 35 races in cat C, both following riders worked harder than the top 1 guy.

The Mann-Whitney U-test gives a test score of -2.15, which translates into a probability, a p-value, of 0.032 (3.2%) for a random occurence. This is lower than the 5% limit we set. There is indeed a difference between the categories and it goes in a direction we did not expect, that there would be no statistically significant difference between the two categories or that if there was, then it would lean in the other direction, towards a tendency for winners in cat A to work less hard compared to the other two on the podium than in cat C. Hence we have to draw the conclusion that we cannot refute the “Oh shit!” scenario.

Conclusions

The “Oh shit!” scenario is real. We do not live in the best of all Watopias. We live in a Watopia where it pays off to work hard in cat A but apparently not so much so in cat C. We live in a Watopia where the category system makes us behave weirdly in races in the lower categories B-D. We live in a Watopia where you can get away with cruising, even on ZwiftPower.

Now we have a choice. We can either accept that racing is inherently unfair in the lower categories and just live with it. Or we can, inspired by other working and efficient category systems in real-life sports, find a new category system that would prevent not only sandbagging but also weird discrepancies such as the one we just looked at, a system that would also unchain racers in all categories and prevent cruising.

Your choice. I have made up my mind already.

Tagged : /

Cruiser Sunday Studies – Part 2

In the last blog post I tried to show that the majority of races in Zwift and on ZwiftPower seem to be won by riders making a smaller effort than riders coming in behind. As you may have had objections to the methodology, I made new little study which I think you will find more methodologically sound.

Method

I went through all races in cat C starting from the strike of midnight between the 16th and the 17th of Aug 2020, working myself backwards until I had had a look at 100 eligible races. Again, a lot of races had to be discarded due to low attendance or due to a missing link on ZP to the Zwift rider profile page for the race in question.

This time I chose to look at the winner in comparison to the no 4 guy, the guy who didn’t quite make it to the podium. Did any of these riders, winners vs 1st losers, on average, seem to make less of an effort than the others? Effort here is defined as a higher workload in terms of HR distribution over the race. A rider who spends more time in higher HR zones than another rider is considered to have worked harder, made a higer effort.

What is to be expected here? Either we could argue that, all else equal, the winners would make more of an effort on average. If two physically equal riders compete (and they will be equal, on average, with large numbers), then the rider who makes the highest effort would win. 

Or we could argue that there should be no difference. Chance, tactics, random occurences, interference by other riders, and powerups may be what decides a race among equals. Everybody should be working roughly equally hard, at least at the top end of the race.

Either of the two scenarios above, or both, is to be considered the baseline, or the null hypothesis, as a scientist would say. If the actual results deviate from this, then it indicates that the null hypothesis isn’t true and that something strange is going on. 

What we don’t expect to see here is for the winner to make less effort than the no 4 guy, because that doesn’t make sense. Or, as I would like to argue, it indicates the presence of cruising, i.e. that some riders stay behind in a category, even though they would meet the requirements of a higher category, just to be able to keep winning. By staying within W/kg limits during races they have an advantage over riders who can only reach W/kg limits by giving it their all. The advantage lies in being able to drop people by having reserves and by not riding at VO2Max.

Anyway, I checked the HR distribution graphs of the winner and the no 4 rider in 100 races in cat C and made notes in a table. If the winner made less effort than the no 4, then the race got a ‘1’ in one column, the ‘Oh shit!’ column. If instead the no 4 rider made less effort than the winner OR if there was no clear difference between the respective HR chart, then the race got a ‘1’ in another column, the ‘As expected…’ column.

Results in Cat C

Out of 100 random, consecutive races in cat C, 61 ended up in the ‘Oh shit!’ column, i.e. the winner made less effort than the no 4 guy. Only 39 races showed a no 4 working harder than the winner or no difference between the two of them.

A Comparison

Before we come to any discussion of the results, a comparison with cat A was needed. If there is indeed cruising going on in cat C, then the same should not be true of cat A. Why? Because the hypothesis is that it is the upper performance limit of the categories B-D that creates the incentive to cruise, whereas in cat A there is no upper limit to performance. The harder you go, the better your chances of winning. There is no downside to going too hard as you don’t risk getting a DQ or an upgrade (unless you present superhuman Watts of course).

Scrounging up races in cat A proved to be significantly harder. Not only are there fewer cat A riders, although they are arguably more active on Zwift than the C guys. And in both the cat C study and the cat A study there had to be at least 4 valid participants (according to ZP) in order to do the comparison between the winner and the no 4 guy of course. So a lot of races had to be discarded for this very reason. 

Secondly, it is far more common among cat A riders to do a spindown or even to keep riding hard after a race as a prolongation of the race as a training session. And while finish times are not affected if you keep riding after the finish line, your HR distribution graph on Zwift.com is. This made comparisons difficult quite often and led to more discarding of races.

Results in Cat A

During the same time period of the 100 races in cat C, only 52 eligible cat A races were found. Of those only 25 races had a winner making less of an effort than the no 4 guy. 27 races showed no difference or a harder working no 4.

We should keep in mind here that there is actually some room for completely legit cruising in A. I have made no distinction between A and A+. Quite often a race is won by an A+ rider who doesn’t have to go flat out to win. Not only do you not go any harder than you can, you also go no harder than needed – if you are already in the lead, then there is no need to push. Still, over half of the races in cat A showed no such difference.

Conclusions

To me this is yet another piece of evidence showing the presence of cruising in Zwift – whether the cruisers are aware of it or not. And it does seem counter-intuitive that you should be at an advantage making less effort than other contenders. This happens because of the upper performance limit in cat B-D. 

You are not allowed to go too hard in cat B-D. It is not forbidden to be too strong though. So as long as you are too strong for your category but manage your performance as to stay within cat limits, then you are a favorite in the race. You don’t always win, but you will win more than your fair share, and you can keep winning indefinitely. ZwiftPower will not upgrade you.

This does not sit well with a sport in my opinion. We should move to a results-based category system, like in real-life sports. Be as strong as you can. Race as hard as you like. Win any race where you are the strongest. But if you keep getting great results in your category time and again over a season, then it’s time for you to get an upgrade. But not because you went too hard but because you did too well too often. 

Thus a sandbagger, going well over the current cat limits, will win legitimately but will get an upgrade soon enough into a category where he is no longer that superior and dominant, and you won’t have to face him anymore. And thus a cruiser can still cruise if he likes, i.e. he can still choose to not go too hard in a race, but he can no longer make less effort than you and still win over and over. If he does go for wins, then he will be upgraded, just like the sandbagger, and he will no longer suck your wheel in your races.

A Zwift with results-based categories is a healthier Zwift. And a more fun Zwift. Fun is Fast. And Fun is Fair!

Footnote

So there was a difference between cat C and cat A but was it just random or what is large enough to be statistically significant, i.e. so large that it is unlikely that it was caused by chance? 

We only had 52 races in cat A. Comparing the first 52 races in cat C with the entire sample of cat A with the Mann-Witney U-test, we get a p-value of 0.088. So it’s not statistically significant at a 5% confidence level (although at the 10% level). I will come back with a larger sample, e.g. 100 races in each category, as I am convinced that the difference will stand and will then be statistically significant.

Tagged :

Cruiser Sunday Studies – Part 1

As a follow-up to the last couple of posts about cruising and the weird effort limits the W/kg category system imposes on us, I decided to do a little pseudo-scientific study of the racing in Zwift.

Previously I have claimed that the W/kg system favors making less effort than competitors in a race, if the objective is to win. If you haven’t read the last couple of posts (you should read all of them), then you might ask yourself, how does that make sense? That couldn’t possibly be right, could it? All else equal, sports are won by people making more effort than their competitors, isn’t that so?

And the awful truth is that, yes, in all sports except Zwift this is indeed so. But Zwift is different, I have claimed, since it has a uniquely weird categorization that imposes an upper limit to your power output in categories B-D – regardless of your perceived effort, I might add. This would then mean, if I am right, that ideally, if you are set on winning races in Zwift, you would race in a category you are too strong for but still make sure to stay within the category’s upper W/kg limits. You would then not get disqualified by ZwiftPower but still be able to beat competitors in climbs, sprints, surges, what have you. In other words, you would likely win. (Unless you are up against several other guys like you, i.e. several other cruisers, whether they cruise the race intentionally or not.) And not only would you likely win, you could also repeat this indefinitely. You would keep winning over and over and still be allowed to stay in your category.

So let’s put these claims to the test. I took a random day (today, Sun Aug 17) and went through all the races from midnight to midnight to see if winners did indeed make less effort than the others.

The idea here is that the occurence of a winner making less of an effort compared to others becomes apparent by studying HR distribution graphs on the Zwift website. If e.g. someone wins a race spending most of it in HR Zone 3, yellow, and does so against a runner-up who spent most of the race in Zone 4, orange, and both are at or close to the W/kg limits of the category, then that indicates that the winner could go harder still, just like the runner-up. Only going harder might push the winner above limits and result in a DQ or even a category upgrade. So the winner wins by being the strongest and by making less effort.

Method

I went through over 80 races in those 24 hours and studied cat B. (We all feel we know cheating is abundant in cat D, right, so what about B?) Of those 80 races about half of them had to be discarded. I set a lower limit of at least 5 eligible participants in cat B (according to ZP) because I wanted to make sure there had been at least some kind of dynamics during the race. The far most common reason for a race to get discarded was indeed lack of participants. But there were also some age category races and some others special cases that did not lend themselves to a comparison between cat B riders.

For a race to qualify as having been won by someone making less effort than others I looked excludingly at the podium, even though I have claimed before that cruisers are over-represented not just among winners but the entire podium. This is because there are often more cruisers than one in a race, I have claimed. So we should actually look beyond the podium, but I had to simplify a bit.

So, anyway, the heuristics here was that if the winner made significantly less effort than either of the no 2 or no 3 guy, then the race would qualify as having been won through less effort

Doesn’t it distort things comparing one guy to two? Wouldn’t on average at least one other guy have made more effort than the winner just by random chance? Well, is that your experience from other sports in the categories below the top one? Also, you need to consider how the comparison was made. To qualify as less effort, it had to be significantly, visibly so. I looked at in what zone(s) most of the time in race was spent and if there was an obvious difference compared to the rest of the podium. 

It is, after all, rather conspicuous and intriguing if the winner sits mainly in Zone 3 if the no 3 guy races on the threshold, don’t you think? How would you explain that? All on the podium are at the top of the category but the winner is not the one having a near-death experience? (Keep in mind the upper W/kg limit here, which does not exist in other sports where categories are based on past results rather than, weirdly enough, past power outputs.) I would then say it clearly supports my claims.

It should be added that in cases where a rider did not use a HR monitor, I have counted that as less effort per default, regardless of whether it was the winner or any of the other two. So in one case there is a race where the winner, although he did seem to slouch around in Zone 3 mainly, was up against two others with no HR monitors and thus that particular race was not deemed as having been won by someone making less effort.

Results

Of 43 eligible races in cat B on this date, 30 were won by someone making less effort than either or both of the no 2 and no 3. In 13 races the difference in effort was not significant or the winner made more of an effort than the others.

Conclusions

If you want to win a Zwift race on ZwiftPower, the odds speak strongly in favor of making less effort than others in the front group. Don’t push yourself too hard! Relax. Cruise. And you will likely win.

Tagged :

A Clarification: Cruising Cat B

The other day I posted a reply to a thread on the Zwift forum. If you didn’t get the point of the previous blog post, the one about Ethics in Zwift, then maybe my reply can serve as a clarification. So I thought I would repost it here.

As usual, I don’t want to expose names. (Dig yourself if you must.) Names are not interesting, at all. Nothing of the problems with Zwift racing that I write about has anything to do with individual subscribers anyway. Rather, I cover a system that is falling apart because it was flawed to begin with. And it is this system that creates cheating by promoting it. And if this system creates a whole bunch of cheaters, it also creates ten times as many weird and unfair situations in races on a daily basis even though it can’t be classified as cheating.

Anyway, a guy in cat B despairs after a race and decides to seek advice from the forum. And I would guess this isn’t the first time he despairs. Nor the last. It was probably just the average race and thus a representative one. Our rider is on top of cat B in terms of his sustainable W/kg, but he is light and weighs in at only 67 kg. 

Now, the problem was that even though our rider put out an impressive average effort of 4.1 W/kg over the race, barely admissible by ZP standards, he still came in outside the top 10. On ZP. And so he asks the forum, what’s wrong with his race tactics? 

Many of us can sympathize with that because we have been in exactly the same situation. You fight your way up to what you think should be the top of your category only to find that you’re not there still. And after a while you begin to suspect that you never will be, and that you will sooner get moved to the next category than get a podium placing (the light rider’s curse). And you know what? You’re right. You’re are screwed. You were screwed even before you started racing in Zwift, and you only realized it now.

With that backdrop, here was my reply:

I’m not racing in B but then again B, C and D are all the same, while A is an entirely different beast. I think responder X leaves an important clue above here.

Like he says, most of those above you in the results list have at least a sliver of green in their NP bar, meaning they have higher variability in their power output than you. Like you say, meaning they can. Whereas you – I’m guessing here – are more in an all-out effort and not able to match them in e.g. small climbs since, like you say, you have little to spare. They on the other hand…

Plus you are already at a disadvantage being on the lighter side among the top X, since you need to push higher W/kg to stick with the heavies on flattish roads. And being light alone doesn’t benefit you as much as one might think even in a climb.

The next thing you should look at now is the other riders’ race profiles on the Zwift website, quickly accessed through the little green bar diagram symbols on the far left on the ZP race report. (ZP is down right now or I’d look myself.)

Take a look at their HR distribution diagrams. Are they different from yours? Do they have more time spent in Zone 3 or lower Zone 4 than you? If so, then there is your explanation to the disappointing result. If they are not working as hard as you, no wonder they have juice to spare at critical moments. And so you get dropped.

I point out two important things above:

1. At some point you as a lighter rider will have to go over W/kg cat limits to stay with a heavier guy who is onthe limit. (Sums up the entire race, doesn’t it?) So as a lighter rider you are basically already screwed. You can’t really both win and stay in cat (unless you race in A). The race favors a heavier rider, given equal W/kg capabilities. Any race does, except the rare race including a very long climb. Granted, at some point weight turns into overweight and body fat doesn’t help you race. But there is a sweetspot in cat B-D. And whatever it is (it’s dependent on other race participants’ weights), it’s higher than your 67 kg for sure since your weight is below the race average. Is this cycling physics? No, it’s Zwift race rules and just that. See below.

2. Given that you both respect W/kg cat limits but barely so, you will always be at a disadvantage against someone who is making less effort than you. Yes, that’s correct! Zwift actually favors cruising a race.

Sandbagging is not the most common form of cheating in Zwift. Cruising is. It’s just not as visible, unless you start digging in data on Zwift and ZP. How to win a race in cat B-D in Zwift and ZP is you get fitter so as to outgrow your cat but still stick around. You never pull, always draft. You always monitor your avg. W/kg as to not go over limits although you could. You leave a little room to spare in that average. And then in climbs or similar you bring down the hammer briefly. If you don’t do this, then someone else will. In basically any and every race. You need to get really lucky to sign up to a race with no cruisers in it.

Cruising as a form of cheating is real. Then on top of that there is a huge grey area where people aren’t exactly (or consciously) cheating but their levels of effort still differ significantly in a race. And who is to say how much you are supposed to suffer in a race? Shouldn’t you be allowed to race any way you like, it’s your body after all? And the answer is yes of course. But then also, should someone who doesn’t want to go too hard have the upper hand in a race? I don’t know. Occasionally maybe? But in every race?! Because that is what we have, a race system that will always favor riders who don’t want to go too hard. Zwift Velominati rule #1: STFU – Soften The F… Up, kinda.

It all boils down to the W/kg system in Zwift, as promoted by ZP, being utterly inappropriate as a race categorization. And there is nothing like it in any RL sport. It is unique and uniquely inappropriate. We can never get away from Watts and kg because both are needed for accurate and fair simulations on a smart trainer in cat A. But they won’t do as a way to split up riders into categories to make racing interesting for all.
What is needed is instead a race categorization based on past results, just like in US cycling, World Cup skiing etc etc, a proven concept. It works. And it would work for Zwift too and make racing more intuitive and interesting.

You enter a race and don’t feel like going too hard, you just wanted to participate for fun and fitness. Ok fine, but you don’t win. Agreed? Fair deal?

You enter another race and don’t feel like going too hard (except at crucial moments like small climbs) and it turns out you still outperform the other riders because they are weaker even though they go flat out. Ok fine, you win this time. Kudos to you for being so strong!

You enter yet another race and don’t feel like going too hard, and it turns out you still outperform the other riders. Not fine. Because now you have already been on the podium in many races in your category and it’s time you get moved up to the next category where you obviously and rightfully belong. And a results-based categorization does exactly that. It’s self-sanitizing.

You can’t put upper limits on people’s efforts in a single competition or race. (You have to do that between races.) “Go hard! But not too hard!” That goes against reason and the nature of sports. Time for a change.

At the time ZP was down. Since then I have had the opportunity to have a look at the HR distribution graphs of the riders in that race. Our rider looks like this:

Our rider’s graph looks a little odd in that so much time is spent in Zone 5. It turns out he has a max HR that goes at least 10 bpm higher than the average for his age. And so without adjusting HR zones, what looks like a Zone 5 effort is rather an upper Zone 4. But even so, as I suspected he is on the threshold most of the race. For a few seconds here and there he gets to coast a bit, but you know what it’s like doing 30/15’s. Those 15 seconds are not enough to bring your HR down. And thus we see less variability at the upper end. He can push it a little when he is forced to but not by much. There is little to spare.

Some of the guys higher up in the placings are working hard too but there are also some guys like this:

He finishes the race a few seconds ahead of our rider. With his higher variability of power output he probably sprinted the crap out of our rider and a few others. But how do you beat a guy like this one? You can’t! He will still have a whole pocket full of matches as you strike your last one.

These two riders are competing in the same category with the same artificial upper effort limit. They are not allowed to go any harder than 4.0 (+0.1) W/kg according to ZP. Who would you rather be hitting 4.0 if the task is to win the race? (That’s usually what races are about.)

This is not to say that a rider like ours above wouldn’t look the same if he was somewhere in the middle of a category in a proper and sound results-based race categorizaation. He would. And he still wouldn’t win. The difference, though, is that the fights for the podium in any such category would be hard, fair and equal for anyone except for those just passing through the category. Let them pass through. And let the real racing begin.

I say it again: 

You cannot put an upper limit to rider effort in a race.

It’s a nobrainer, it really is. Stop hugging an idiotic system just because it feels familiar to you. Once upon a time you were a neophyte zwifter and everything was new and unfamiliar. It’s time to go out in deep waters again. Knee-deep. I know, it’s scary. But you will be fine, I promise.

Tagged :